
Biofuel production remains expensive per gallon primarily due to volatile feedstock prices and production economics that have swung from modest profit to persistent loss over the past several years. According to farm economics research, U.S. biodiesel producers averaged a loss of about -$0.10 per gallon (including tax credits) from 2021 through early 2026, compared with a small average profit of roughly +$0.05 per gallon from 2007 to 2020. Without federal tax credit support, the picture is starker still: producers would have averaged roughly -$0.26 per gallon since 2021, and market signals indicated biodiesel plants were effectively uneconomical to run in nearly every week since the start of 2026 absent that credit. U.S. biodiesel production capacity also contracted in 2026, with roughly eight plants closing due to poor margins. These economic pressures, combined with a newly restructured federal tax credit and ongoing sustainability challenges, continue to complicate the biofuel landscape.
Key Takeaways
- U.S. biodiesel producers averaged roughly -$0.10 per gallon (with tax credits) from 2021 through early 2026, versus about +$0.05 per gallon during 2007-2020, per University of Illinois farm economics analysis.
- Without tax credit support, producer margins would have averaged closer to -$0.26 per gallon since 2021 — a level at which most plants would not economically operate.
- The old $1.00-per-gallon biodiesel blender’s tax credit expired at the end of 2026 and was replaced by the Section 45Z Clean Fuel Production Credit, effective January 1, 2026 through December 31, 2029.
- The 45Z credit is estimated at roughly $0.32 per gallon in 2026 and about $0.66 per gallon in 2026 for eligible non-SAF transportation fuel, scaled by a fuel’s carbon-intensity score.
- U.S. biodiesel production capacity declined in 2026 as roughly eight plants closed on weak margins, even as total U.S. biofuels capacity growth slowed to about 3% year over year.
- EPA’s final Renewable Fuel Standard rule for 2026-2027 sets record blending mandates, guaranteeing at least 5.33 billion gallons of biomass-based diesel use in 2026 and 5.75 billion gallons in 2027.
Historical Price Trends
You may be interested
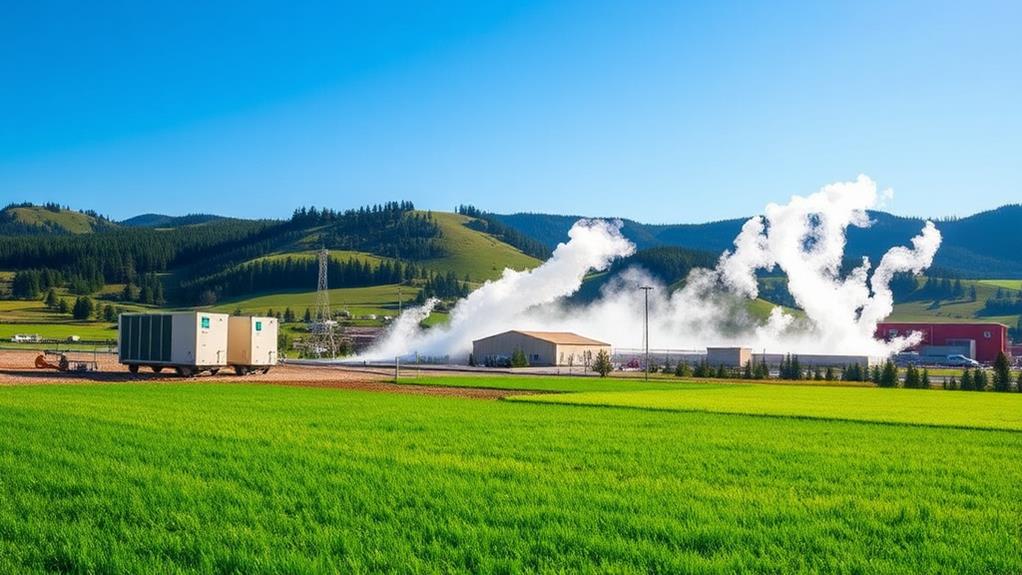

Over nearly two decades, biodiesel producer margins have shifted from roughly break-even to persistently negative. Between 2007 and 2020, producers averaged a small positive margin of about +$0.05 per gallon when tax credits are included, according to farm economics research from the University of Illinois. That changed sharply after 2020: producer economics deteriorated to an average of about -$0.10 per gallon from 2021 through early 2026, with the worst stretch around 2021 seeing losses approach roughly -$1.50 per gallon at points. Much of the recent support for producer margins has come from federal tax credits — first the blender’s tax credit through 2026, and now the Section 45Z Clean Fuel Production Credit that took effect in 2026. Analysts note that without that credit revenue, price signals would have indicated it was uneconomical to keep production running in nearly every week since the start of 2026, underscoring how dependent current production economics are on policy support.
Price Comparison Analysis

The fluctuations in biodiesel producer margins paint a clear picture of the financial landscape for producers. Biodiesel and renewable diesel have generally cost more to produce than conventional diesel, and that premium is a key reason blending mandates and tax credits exist in the first place. Here’s a breakdown of key data points from current research and government sources:
| Metric | Value | Source / Period |
|---|---|---|
| Average biodiesel margin, 2007-2020 (with tax credit) | +$0.05/gallon | farmdoc daily, Univ. of Illinois |
| Average biodiesel margin, 2021-early 2026 (with tax credit) | -$0.10/gallon | farmdoc daily, Univ. of Illinois |
| Average biodiesel margin, 2021-early 2026 (without tax credit) | -$0.26/gallon | farmdoc daily, Univ. of Illinois |
| 45Z Clean Fuel Production Credit, 2026 | ~$0.32/gallon | IRS / farmdoc daily |
| 45Z Clean Fuel Production Credit, 2026 | ~$0.66/gallon | IRS / farmdoc daily |
| U.S. biodiesel plant closures, 2026 | ~8 plants | U.S. EIA |
| 2026 RFS biomass-based diesel guaranteed volume | 5.33 billion gallons | EPA final RFS rule |
| 2027 RFS biomass-based diesel guaranteed volume | 5.75 billion gallons | EPA final RFS rule |
These figures highlight the ongoing market volatility affecting biofuel production economics, and why policy — both blending mandates and tax credits — plays such an outsized role in whether plants stay open. Readers comparing the economics of biofuels to other renewable options may also find our green energy vs. fossil fuel price comparison useful context.
Recommended Products


Profitability Assessment

When evaluating the profitability of biodiesel production, it’s essential to take into account both historical profit trends and current production costs. Recent research shows the industry has moved from a roughly break-even to slightly profitable position pre-2021 to a persistent-loss position since, even with tax credit support factored in. That shift reflects a combination of higher feedstock costs, elevated marketing and logistics costs, and a gap between the expired blender’s credit and the newly phased-in 45Z credit.
Recommended Products

Historical Profit Trends
Analyzing historical profit trends in the biodiesel industry reveals a turbulent landscape marked by significant fluctuations. Key factors that have influenced profitability include:
- Average margin, 2007-2020 (with credit): about +$0.05 per gallon.
- Average margin, 2021-early 2026 (with credit): about -$0.10 per gallon.
- Average margin, 2021-early 2026 (without credit): about -$0.26 per gallon.
- Worst period: margins approached roughly -$1.50 per gallon around 2021 before the renewable diesel capacity buildout matured.
These trends illustrate the financial burden faced by biofuel producers, as maintaining production capacity becomes increasingly cost-prohibitive when feedstock costs rise faster than fuel prices and tax credit policy lags behind. Understanding these dynamics is essential for anyone involved in the biodiesel sector, since they highlight the ongoing challenges to long-term profitability without continued policy support.
Current Production Costs and the 45Z Credit
Current production costs in the biodiesel industry continue to reflect the challenges highlighted by historical profit trends. The prior $1.00-per-gallon biodiesel blender’s tax credit expired at the end of 2026. In its place, the Section 45Z Clean Fuel Production Credit became available starting January 1, 2026 and runs through December 31, 2029, per IRS guidance. Unlike the flat blender’s credit, 45Z is a sliding-scale, producer-side credit tied to a fuel’s carbon-intensity score, and it is transferable between entities. Current estimates put the credit at roughly $0.32 per gallon in 2026, rising to about $0.66 per gallon in 2026 for eligible non-SAF transportation fuel. Fuel produced after December 31, 2026 must also be made exclusively from feedstocks grown or produced in the United States, Mexico, or Canada to remain eligible — a new sourcing requirement that could reshape feedstock supply chains. For producers and investors evaluating project economics more broadly, our cost-benefit analysis of green energy projects covers similar frameworks used across the renewable sector.
Production Capacity Changes
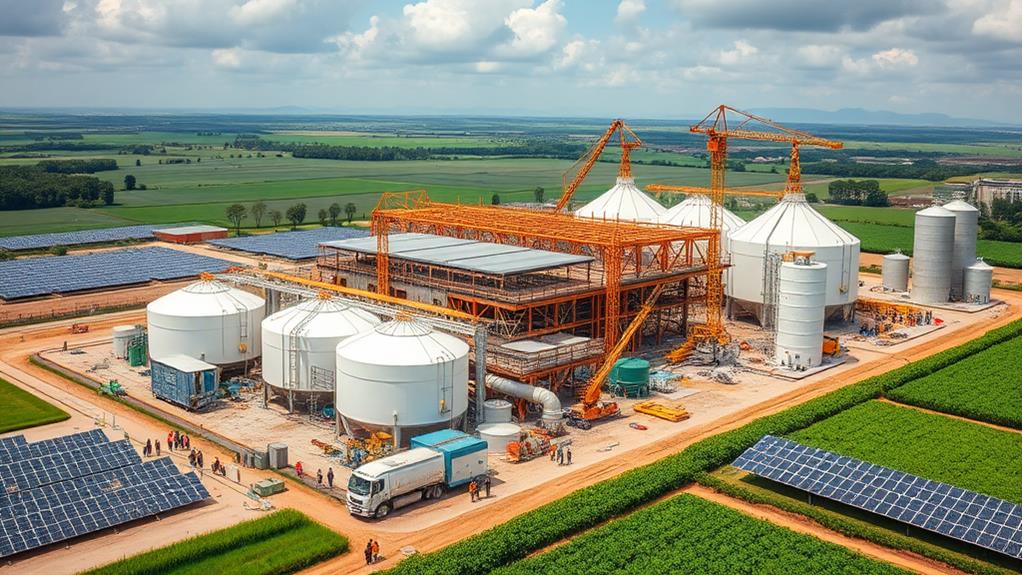
As you explore production capacity changes in the biodiesel sector, fluctuations in capacity clearly track overall cost pressure. According to the U.S. Energy Information Administration, total U.S. biofuels production capacity growth slowed to about 3% from January 2026 to January 2026, a sharp deceleration from prior years. Renewable diesel and other biofuels capacity added only about 391 million gallons annually in that period — far less than the rapid buildout seen from 2021-2023 — while biodiesel capacity actually declined by roughly 100 million gallons as about eight plants closed due to poor margins. Fuel ethanol, by contrast, remains the largest single category at almost 18.5 billion gallons of annual capacity, or about 73% of total U.S. biofuels capacity. This contraction in biodiesel and slowdown in renewable diesel reflect the pressures of market volatility and production losses described above.
Recommended Products

Capacity Fluctuations Impact Costs
Often, fluctuations in production capacity play a crucial role in determining biofuel costs. Key data points from EIA’s most recent capacity survey include:
- Total U.S. biofuels capacity growth slowed to roughly 3% year-over-year as of January 2026.
- Renewable diesel and other biofuels capacity grew by only about 391 million gallons in 2026, well below prior-year additions.
- U.S. biodiesel capacity fell by around 100 million gallons in 2026 as roughly eight plants closed.
- Fuel ethanol remains dominant, at nearly 18.5 billion gallons of annual capacity (about 73% of total biofuels capacity).
These capacity changes directly track production costs, as tighter margins push marginal plants to idle or close. It’s important to understand how these elements intertwine, ultimately affecting biodiesel prices and the broader supply picture for renewable fuels.
Shutdown Signals and Viability
The viability of biodiesel production hinges greatly on the gap between fuel prices net of marketing costs and the cost of production, a gap that tax credits are meant to help close. Farm economics research indicates that, absent 45Z credit revenue, market price signals suggested biodiesel production was uneconomical in nearly every week since the start of 2026 — a striking indicator of how thin margins have become. The roughly eight plant closures recorded by EIA in 2026 illustrate that risk is not merely theoretical. Because the 45Z credit ramps from about $0.32 per gallon in 2026 to about $0.66 per gallon in 2026, near-term producer economics may improve somewhat, but the credit’s carbon-intensity scoring and new North American feedstock-sourcing rule (effective for fuel produced after December 31, 2026) add complexity that could offset some of that gain for producers using imported feedstocks.
Economic Impacts of Biofuels

Biofuels have significant economic impacts that ripple through both energy and food markets. The interplay between biofuel mandates and market dynamics reveals several key factors:
- Biodiesel producer economics have swung from roughly break-even (2007-2020) to a persistent loss (2021-2026) even with tax credits factored in, per University of Illinois farm economics research.
- EPA’s final Renewable Fuel Standard rule for 2026-2027 sets record-high blending volumes, guaranteeing at least 5.33 billion gallons of biomass-based diesel use in 2026 and 5.75 billion gallons in 2027.
- Higher mandated blending volumes generally support feedstock (soybean oil, corn oil, used cooking oil) demand and pricing, which raises the cost side of the ledger for producers even as it supports farm incomes.
- The shift toward stricter North American feedstock-sourcing requirements under 45Z, effective after 2026, could further tighten feedstock markets for producers who previously relied on imported oils.
Together, these elements underscore the challenges that energy policy faces in balancing renewable fuel growth with production costs and feedstock market stability. For a broader look at how renewable project costs compare across technologies, see our renewable energy project budget template.
Environmental Considerations
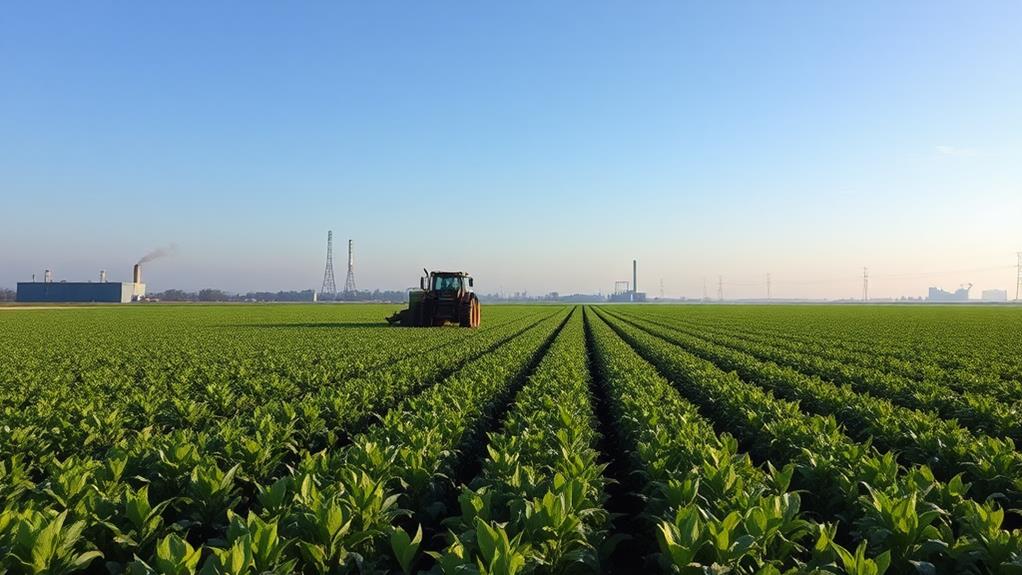
When considering the environmental implications of biofuels, it’s clear that feedstock cultivation can have far-reaching consequences. Expansion of biofuel crop production can contribute to land-use change and, in some cases, habitat pressure when new land is brought into cultivation, which can generate additional greenhouse gas emissions that offset some of the climate benefit biofuels are meant to provide. Nutrient runoff from feedstock crops can also contribute to water quality concerns. The new 45Z credit’s carbon-intensity scoring is explicitly designed to reward lower-emission feedstocks and production pathways, which may help steer the industry toward feedstocks with a smaller land-use footprint over time. The diversion of agricultural land and crops to fuel production also remains a factor in ongoing food-versus-fuel debates among agricultural economists.
Policy Implications
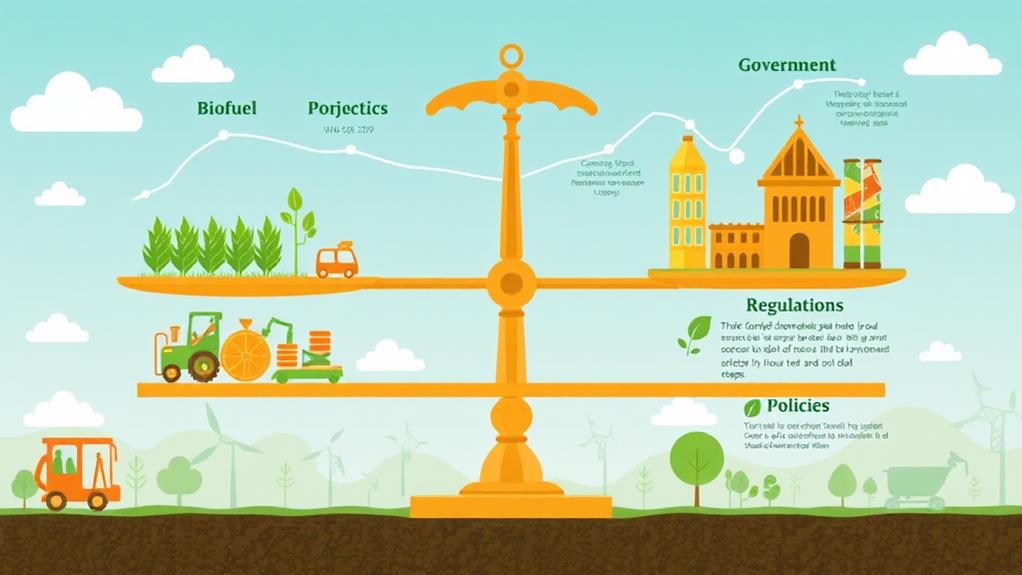
Navigating the policy landscape surrounding biofuels is essential, especially given the significant economic and social implications tied to production costs. Here are some key considerations based on the current regulatory picture:
- Renewable Fuel Standard Mandates: EPA’s final rule for 2026-2027 sets record blending volumes, including at least 5.33 billion gallons of biomass-based diesel use guaranteed for 2026 and 5.75 billion gallons for 2027.
- 45Z Clean Fuel Production Credit: Replacing the expired blender’s tax credit, 45Z runs from January 1, 2026 through December 31, 2029, with credit values estimated around $0.32/gallon in 2026 and $0.66/gallon in 2026, scaled to carbon intensity. See the IRS Clean Fuel Production Credit page for official eligibility details.
- Feedstock Sourcing Rules: Starting with fuel produced after December 31, 2026, 45Z requires feedstocks to be grown or produced in the U.S., Mexico, or Canada, which will reshape sourcing decisions for producers.
- Regulatory Uncertainty: The transition between blender’s credit and producer-side 45Z credit, combined with rising mandated volumes, creates both opportunity and near-term uncertainty for plant investment decisions.
Understanding these factors is vital for shaping effective energy policy that balances biofuel production growth with production costs and market stability. State-level incentive programs can also affect project economics; see our renewable energy incentives by state guide for how state and federal programs interact.
Future Industry Outlook

As we look ahead, the future of the biofuel industry hinges heavily on how the new 45Z credit and record RFS blending mandates interact with feedstock costs. U.S. biodiesel capacity contracted modestly in 2026 amid roughly eight plant closures, and industry economics research shows producers have needed tax-credit revenue just to avoid signaling continuous production losses since the start of 2026. The rising 45Z credit value — from about $0.32 per gallon in 2026 to about $0.66 per gallon in 2026 — combined with record biomass-based diesel mandates of 5.33 billion gallons (2026) and 5.75 billion gallons (2027) could support a modest recovery in producer margins, but the new North American feedstock-sourcing requirement adds a fresh variable. Continuous monitoring of EIA capacity data and EPA rulemaking will remain essential to gauge whether the industry returns to sustainable profitability.
Frequently Asked Questions
Why Are Biofuels Expensive to Produce?
Biofuels are expensive to produce due to complex refining processes, feedstock costs that can be volatile, and the capital required for production facilities. Government policy — including blending mandates and tax credits like the Section 45Z Clean Fuel Production Credit — plays a major role in whether production is economically viable at any given time.
How Much Does Biodiesel Cost to Produce per Gallon?
Recent research from the University of Illinois puts average U.S. biodiesel producer margins at around -$0.10 per gallon (including tax credits) from 2021 through early 2026, compared with roughly +$0.05 per gallon during 2007-2020. Without tax credit support, margins would average closer to -$0.26 per gallon over the same recent period.
Did the Federal Biodiesel Tax Credit Change?
Yes. The prior $1.00-per-gallon biodiesel blender’s tax credit expired at the end of 2026. It was replaced by the Section 45Z Clean Fuel Production Credit, available from January 1, 2026 through December 31, 2029, which pays producers a carbon-intensity-scaled credit currently estimated around $0.32 per gallon in 2026 and $0.66 per gallon in 2026.
Why Have Biodiesel Production Costs Stayed High?
Feedstock costs, the gap between the expired blender’s credit and the newly phased-in 45Z credit, and a roughly 3% slowdown in U.S. biofuels capacity growth in 2026 (with about eight biodiesel plants closing on weak margins) have all kept production economics tight, according to EIA capacity data.
What Is the Biggest Challenge Facing the Biofuel Industry Today?
Sustaining profitability without relying entirely on tax credits is the biggest near-term challenge. EPA’s record 2026-2027 Renewable Fuel Standard blending mandates support demand, but new feedstock-sourcing requirements and carbon-intensity scoring under the 45Z credit add complexity that producers must navigate to remain competitive.


